
 Stakeholder mapping, also known as stakeholder analysis or stakeholder mapping matrix, is a visual representation or tool that helps organizations identify and understand the relationships between different stakeholders involved in a project, initiative, or business. It is a method of categorizing stakeholders based on key criteria such as their level of interest, influence, or potential impact on the project.
Key Attributes
- Interest:
- Influence/Power:
- Impact/Importance:
- Support/Alignment:
- Attitude/Tone:
- Communication Preferences:
- Role/Position:
- Dependencies/Connections:
- Level of Engagement:
- Potential Risks or Concerns:
- Influence on Other Stakeholders:
These attributes are used to plot stakeholders on a visual map or matrix, helping project managers and teams gain insights into the complex web of relationships and dynamics among different stakeholders. The map facilitates strategic decision-making, communication planning, and stakeholder engagement strategies throughout the project lifecycle.
How to
- Identify Stakeholders: Begin by identifying all potential stakeholders associated with the project or initiative. This includes individuals, groups, or organizations that can significantly influence or be influenced by the outcomes.
- Determine Criteria for Mapping: Define criteria for categorizing stakeholders. Common criteria include levels of interest, influence, power, support, or potential impact on the project.
- Plotting on a Matrix or Map: Create a visual representation, often in the form of a matrix or map, where stakeholders are plotted based on the defined criteria. This can be a two-dimensional grid or a more complex diagram.
- Categorize Stakeholders: Place stakeholders into categories or quadrants based on their positions on the map. For example, stakeholders with high interest and high influence may be in one quadrant, while those with low interest and low influence may be in another.
- Analysis and Strategy Development: Analyze the stakeholder map to identify patterns, relationships, and potential areas of concern or opportunity. Develop tailored strategies for engaging with stakeholders in each category.
- Communication and Engagement Planning: Use the stakeholder map to guide communication and engagement planning. Determine how to communicate with each stakeholder group, what information is relevant to them, and how to address their concerns.
Stakeholder mapping is a dynamic process, and the map may evolve as the project progresses or as stakeholder dynamics change. It helps organizations prioritize their efforts by focusing on stakeholders who are most critical to the project’s success. Additionally, stakeholder mapping can uncover potential conflicts, alliances, or dependencies between different stakeholder groups, enabling proactive management of relationships throughout the project lifecycle.
Stakeholder Mapping: Template
Stakeholder Mapping Template (.ppt)
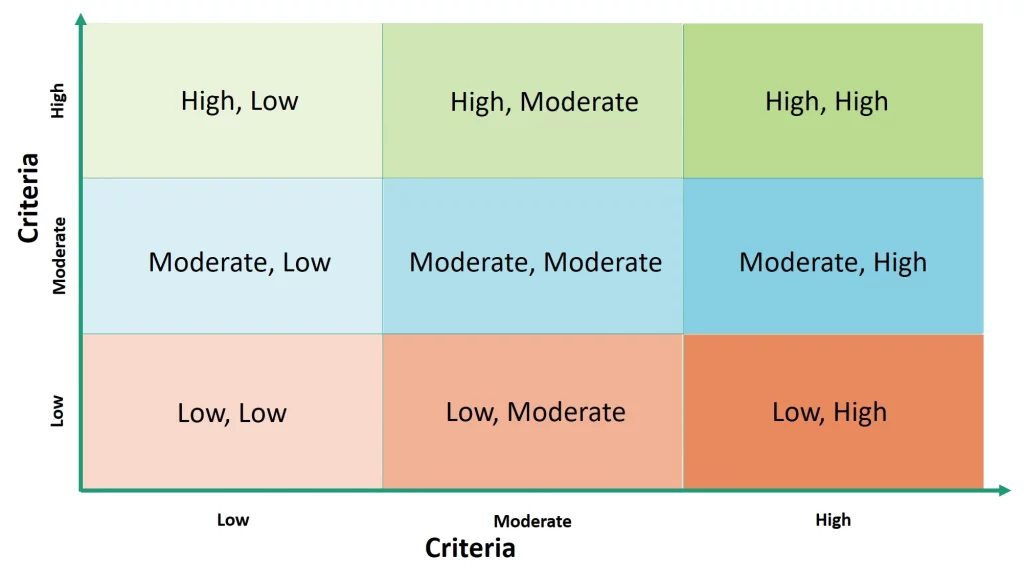
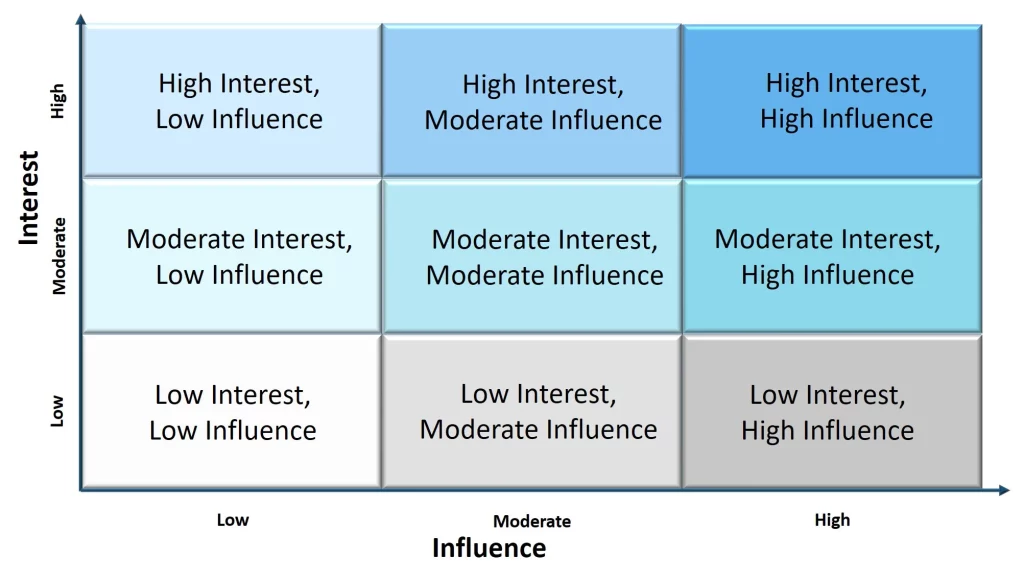
Stakeholder Mapping Template: Interest vs. Influence
Instructions:
- Interest: Evaluate each stakeholder’s level of interest in the project or initiative (Low, Moderate, High).
- Influence: Assess each stakeholder’s influence on the project (Low, Moderate, High).
- Quadrants: Based on the intersection of interest and influence, place each stakeholder in the appropriate quadrant.
Tips:
This template provides a straightforward structure for visually representing stakeholder positions. Depending on your preferences and project needs, you can adapt and expand this template to include additional attributes or details relevant to your stakeholder analysis.
Examples
Apple Inc. Stakeholder Map Matrix: Interest vs. Influence
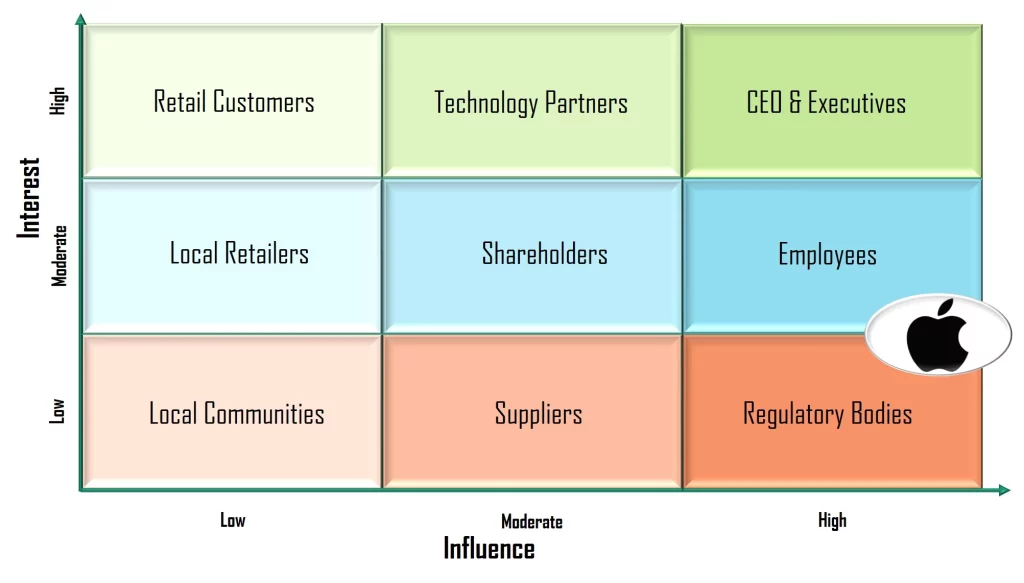
Notes:
Walmart Inc. Stakeholder Map Matrix: Power vs. Dependency
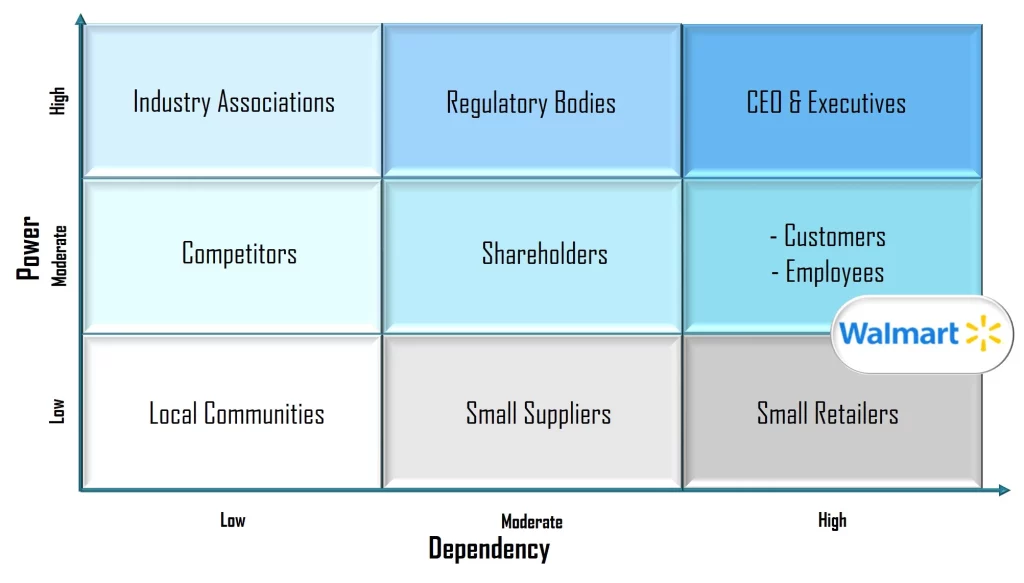
Notes:
This stakeholder map uses power and dependency as attributes to position stakeholders. It provides a simplified representation, and in reality, a more detailed analysis would consider additional factors and a broader range of stakeholders. Stakeholder maps are valuable tools for strategic planning and understanding the dynamics of relationships between an organization and its stakeholders.
Tesla Inc. Stakeholder Map Matrix: Collaboration Potential vs. Environmental Impact
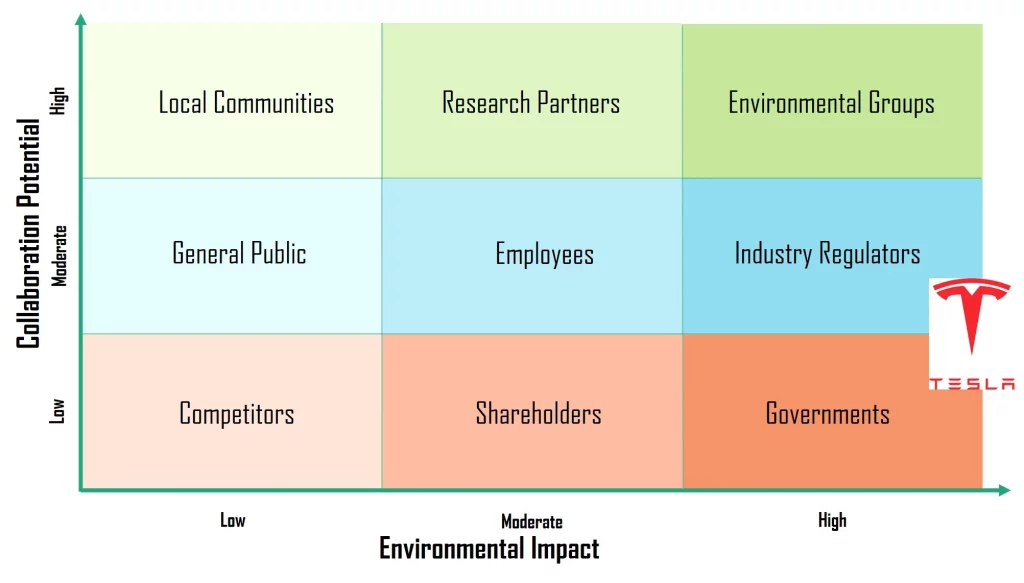
Notes:
Strengths vs. Limitations
| Strengths | Limitations |
|---|---|
| 1. Visual Representation: Provides a clear visual overview of stakeholder positions and relationships. | 1. Simplification: May oversimplify complex stakeholder dynamics, missing nuances. |
| 2. Quick Understanding: Enables a quick understanding of key stakeholders and their relative importance. | 2. Subjectivity: Assessment of interest and influence can be subjective and vary among team members. |
| 3. Identification of Patterns: Helps identify patterns, connections, and potential areas of collaboration or conflict. | 3. Limited Attributes: Typically focuses on two criteria (interest and influence), omitting other relevant attributes. |
| 4. Strategic Planning: Facilitates strategic planning by focusing on stakeholders with high influence and interest. | 4. Dynamic Changes: Stakeholder positions may change dynamically, requiring frequent updates to the map. |
| 5. Effective Communication: Aids in tailoring communication strategies based on stakeholder positions. | 5. Resistance to Change: Stakeholders might resist being categorized, affecting their engagement. |
| 6. Prioritization: Supports the prioritization of stakeholder engagement efforts based on their positions. | 6. Lack of Granularity: Might lack granularity for in-depth analysis of specific stakeholder attributes. |
| 7. Enhanced Decision-Making: Contributes to informed decision-making by considering stakeholder positions. | 7. Limited Stakeholder Input: Stakeholders may not have direct input into their position on the map. |
| 8. Cross-Functional Collaboration: Encourages collaboration across different teams or departments. | 8. Overemphasis on Power Dynamics: May overemphasize power and influence at the expense of other factors. |
| 9. Adaptability: Can be adapted to different project contexts and industries. | 9. Interconnected Relationships: May not fully capture the interconnected nature of stakeholder relationships. |
| 10. Feedback Mechanism: Provides a basis for feedback loops, allowing adjustments based on stakeholder responses. | 10. Static Representation: Can be perceived as a static representation, not reflecting changing stakeholder dynamics. |
When using a stakeholder map, it’s crucial to consider these strengths and limitations to maximize its effectiveness in stakeholder analysis and management. Regular updates, clear communication, and collaboration among team members can address some of the limitations and enhance the benefits of using a stakeholder map.
Stakeholder Identification Matrix vs. Stakeholder Mapping
- Stakeholder Identification Matrix:
- Stakeholder Map (or Stakeholder Analysis Map):
Key Differences:
In practice, organizations may use both tools in conjunction. The stakeholder identification matrix can serve as a detailed reference document, and the stakeholder map can offer a visual snapshot for quick comprehension of stakeholder relationships. The choice between the two often depends on the specific needs of the project and the preferences of the project team.
Tips on How to Create a Successful Stakeholder Map
- Clear Objectives: Clearly define the objectives of the stakeholder map, specifying what you aim to achieve or understand through the mapping process.
- Select Appropriate Attributes: Choose relevant attributes for mapping, considering factors such as power, interest, collaboration potential, or any other criteria pertinent to your specific context.
- Thorough Research: Conduct thorough research to gather accurate and up-to-date information about each stakeholder, ensuring a comprehensive understanding of their roles, interests, and influence.
- Engage Stakeholders: Whenever possible, engage directly with stakeholders to gather insights, validate assumptions, and ensure their perspectives are considered in the mapping process.
- Consider Dynamics Over Time: Recognize that stakeholder dynamics can change over time. Regularly revisit and update the stakeholder map to reflect evolving relationships and circumstances.
- Prioritize Relevance: Focus on stakeholders that are most relevant to the organization or project. Prioritize those with higher influence and interest to streamline strategic efforts.
- Maintain Flexibility: Be flexible in adapting the stakeholder map to changing conditions. Acknowledge uncertainties and be open to adjusting positions based on new information.
- Collaborative Approach: Involve cross-functional teams and diverse perspectives within the organization to ensure a comprehensive understanding of stakeholder relationships.
- Communicate Clearly: Clearly communicate the purpose and outcomes of the stakeholder mapping exercise to relevant stakeholders, fostering transparency and understanding.
- Visual Clarity: If using a visual representation, ensure the stakeholder map is clear and easy to interpret. Use color-coding, labels, or other visual cues to enhance understanding.
- Integrate Feedback: Incorporate feedback from stakeholders and team members to refine the stakeholder map, enhancing its accuracy and relevance.
- Align with Strategy: Ensure that the stakeholder map aligns with the organization’s overall strategy, guiding decision-making and resource allocation.
In conclusion, the goal of a stakeholder map is to visually depict and analyze relationships between an organization and its stakeholders, facilitating the identification of key stakeholders, informed decision-making, strategic planning, and enhanced communication.