
 Income statement analysis, also known as profit and loss (P&L) analysis, involves the examination and interpretation of a company’s income statement. The income statement, one of the three main financial statements, summarizes a company’s revenues, expenses, and profits over a specific period, such as a quarter or a year.
Key Terms
| Term | Definition |
|---|---|
| Revenue (Sales) | The total amount of money earned by the company from its primary business activities, such as sales of goods or services. |
| Cost of Goods Sold (COGS) | The direct costs associated with producing the goods or services sold by the company, including materials and labor. |
| Gross Profit | The difference between revenue and the cost of goods sold, representing the profit generated from core business operations. |
| Operating Expenses | The costs incurred in the day-to-day operations of the business, including salaries, rent, utilities, marketing, and other overhead expenses. |
| Operating Income (Operating Profit) | The profit derived from subtracting operating expenses from gross profit, indicating the company’s profitability from its core operations. |
| Interest, Taxes, Depreciation, and Amortization (EBITDA) | Earnings Before Interest, Taxes, Depreciation, and Amortization is a measure of a company’s operating performance, excluding non-operating expenses. |
| Net Income | The final profit or loss figure after deducting all expenses, taxes, and interest from revenue, representing the company’s bottom line or overall profitability. |
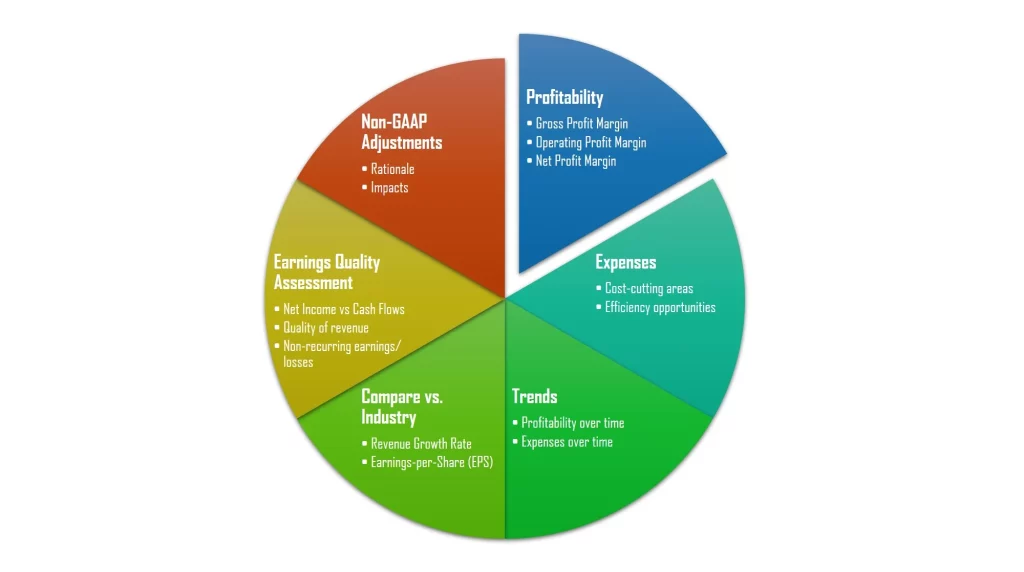
Key Activities
| Activity | What to Assess | Specific Focus | Interpretation |
|---|---|---|---|
| Profitability Analysis | Overall profitability of the company | – Gross Profit Margin = (gross profit / revenue) * 100
– Operating Profit Margin = (operating profit / revenue) * 100 – Net Profit Margin = (net profit / revenue) * 100 |
Higher margins indicate better profitability. |
| Expense Analysis | Efficiency and control over expenses | – Identify major expense categories
– Assess expense trends over time |
Identify cost-cutting opportunities and operational efficiency opportunities. |
| Trend Analysis | Changes and patterns in financial performance | – Compare income statements over multiple periods
– Revenue/ Profitability over quarters/ annual/ time – Expenses over time |
Identify and elaborate on trends in revenue growth, expense management, and overall performance. |
| Comparative Analysis | Company performance relative to industry benchmarks or competitors | – Compare key ratios with industry averages: revenue growth rate, earnings per share (EPS)
– Benchmark against competitors |
Assess the company’s relative position and competitiveness within the industry. |
| Earnings Quality Assessment | The sustainability and reliability of reported earnings | – Assess consistency in earnings growth
– Assess the consistency and reliability of reported profits. – Examine non-recurring items and one-time gains/losses |
Ensure earnings are not artificially inflated or volatile. |
| Non-GAAP Adjustments | Evaluation of non-GAAP measures provided by the company | – Understand the rationale for non-GAAP adjustments
– Assess impact on reported earnings |
Consider whether non-GAAP adjustments provide a clearer picture of performance. |
These activities provide a comprehensive approach to income statement analysis, offering insights into the company’s profitability, expense management, trends, competitiveness, earnings quality, and the impact of non-GAAP adjustments. Interpretations should take into account industry benchmarks, historical performance, and the company’s specific business context.
Example: Apple Inc. Income Statement Analysis (2020-2023)
A. Profitability Analysis
| Profitability Ratio | 2020 | 2021 | 2022 | 2023 |
|---|---|---|---|---|
| Gross Profit Margin | = (104956/ 274515) * 100
= 38.23% |
= (152836/ 365817) * 100
= 41.78% |
= (170782/ 394328) * 100
= 43.31% |
= (169148/ 383285) * 100
= 44.13% |
| Operating Profit Margin | = (66288/ 274515) * 100
= 24.15% |
= (108949/ 365817) * 100
= 29.78% |
= (119437/ 394328) * 100
= 30.29% |
= (114301/ 383285) * 100
= 29.82% |
| Net Profit Margin | = (57411/ 274515) * 100
= 20.91% |
= (94680/ 365817) * 100
= 25.88% |
= (99803/ 394328) * 100
= 25.31% |
= (96995/ 383285) * 100
= 25.31% |
B. Expenses Analysis
| Expense | 2020 | 2021 | 2022 | 2023 |
|---|---|---|---|---|
| Selling/General/Admin. Expenses, Total | 19916 | 21973 | 25094 | 24932 |
| Research & Development | 18752 | 21914 | 26251 | 29915 |
| Depreciation / Amortization | 1356 | 1784 | 2404 | 3019 |
| Interest Expense (Income) – Net Operating | -2873 | -2645 | -2931 | -3933 |
| Other Operating Expenses, Total | 1517 | 861 | 527 | 914 |
C. Trends Analysis
Let’s conduct a trends analysis for Apple Inc using the provided data for the years 2020 to 2023:
- Gross Profit Margin:
- Operating Profit Margin:
- Net Profit Margin:
- Selling/General/Admin. Expenses:
- Research & Development (R&D) Expenses:
- Depreciation / Amortization:
- Interest Expense (Income) – Net Operating:
- Other Operating Expenses:
D. Comparative Analysis (vs. Industry Averages)
| Ratio | Apple Inc. | Technology Industry |
|---|---|---|
| Y/Y Revenue Growth (Q4 MRQ) | 2.07% | 6.82% |
| 5-Year Average Revenue Growth Rate | 7.61% | 9.31% |
| 5-Year Average Operating Income Change | 10.02% | 10.62% |
| 5-Year Average Net Income Growth | 10.26% | 10.79% |
| Y/Y EPS Net Growth (Q4 MRQ) | 15.96% | 39.65% |
| 5-Year Average EPS Net Change | 15.54% | 11.79% |
Let’s conduct a comparative analysis of Apple Inc. against the Technology Industry based on this data:
- Year-over-Year (Y/Y) Revenue Growth (Q4 MRQ):
- 5-Year Average Revenue Growth Rate:
- 5-Year Average Operating Income Change:
- 5-Year Average Net Income Growth:
- Y/Y Earnings-per-Share (EPS) Net Growth (Q4 MRQ):
- 5-Year Average EPS Net Change:
- Overall Assessment:
E. Earnings Quality Assessment
| Earnings (Cash Flows) | 2020 | 2021 | 2022 | 2023 |
|---|---|---|---|---|
| Net Income | 57411 | 94680 | 99803 | 96995 |
| Cash From Operating Activities | 80674 | 104038 | 1122151 | 110543 |
| Cash From Investing Activities | -4289 | -14545 | -22354 | 3705 |
| Cash From Financing Activities | -86820 | -93353 | -110749 | -108488 |
| Net Change in Cash | -10435 | -3860 | -10952 | 5760 |
Let’s perform an earnings quality assessment for Apple Inc. using this financial data for the years 2020 to 2023:
- Consistency in Earnings and Cash Flow:
- Operating Cash Flow vs. Net Income:
- Cash Flow from Investing and Financing Activities:
- Net Change in Cash:
- Quality of Revenue:
- Overall Assessment:
Tips
- Understand the Basics: Familiarize yourself with the basic components of the income statement, such as revenue, expenses, and net income.
- Calculate and Analyze Ratios: Use financial ratios to assess profitability, liquidity, solvency, and efficiency. Ratios provide a quantitative basis for comparing performance.
- Look Beyond the Numbers: Consider the qualitative aspects of earnings, including the quality of revenue, sustainability of profit margins, and potential non-recurring items.
- Compare Over Time: Conduct trend analysis by comparing income statements over multiple periods. This helps identify patterns, growth trajectories, and potential areas of concern.
- Benchmark Against Industry Peers: Compare the company’s ratios and performance metrics with industry averages or competitors to gauge its relative standing. Learn more on industry analysis.
- Evaluate Non-GAAP Adjustments: Assess any non-GAAP adjustments made by the company. Understand the rationale behind these adjustments and their impact on reported earnings.
- Consider External Factors: Be mindful of external factors, such as economic conditions, industry trends, and regulatory changes, that may influence the company’s financial performance.
- Review Management Discussions: Read management discussions and analyses accompanying financial statements to gain insights into the company’s strategic initiatives and future prospects.
- Assess Earnings Quality: Evaluate the sustainability and reliability of reported earnings by examining cash flow, provisions, and the transparency of financial disclosures.
- Maintain a Comprehensive View: Combine income statement analysis with assessments of other financial statements, such as the balance sheet and cash flow statement, to get a comprehensive view of a company’s financial health.
In conclusion, by employing a systematic and comprehensive approach, analysts can extract meaningful insights from income statements, aiding in informed decision-making and a thorough understanding of a company’s financial performance.