
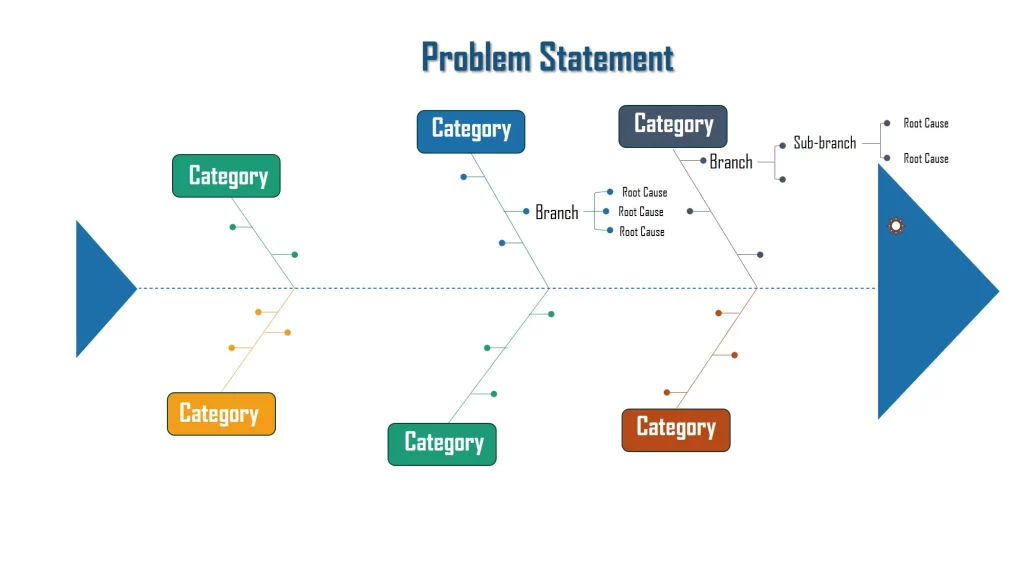
A Fishbone diagram, also known as an Ishikawa diagram or Cause-and-Effect diagram, is a visual tool used in Root Cause Analysis (RCA) to identify and organize potential causes contributing to a problem. It was developed by Japanese quality control expert Kaoru Ishikawa and is named after its fishbone-like appearance, which resembles the skeletal structure of a fish.
Fishbone Diagram: Structure
- Problem Statement: The problem or effect being analyzed is written at the head of the fishbone diagram.
- Major Categories: The main “bones” of the fish represent major categories of potential causes. Common categories include:
- Branches: Subsequent branches extend from each major category, representing specific factors or causes related to that category.
- Contributing Factors: Further branches or sub-branches may be added to elaborate on specific contributing factors or causes within each category.
- Analysis and Prioritization: The team conducting the RCA analyzes each potential cause to determine its relevance and impact on the problem. Causes may be prioritized based on their significance and likelihood of contributing to the problem.
- Identification of Root Causes: Through discussion and analysis, the team identifies potential root causes among the listed factors. These are the underlying issues that, when addressed, can prevent the recurrence of the problem.
- Corrective Actions: Once root causes are identified, the team can develop corrective actions to address them and improve the situation.
By visually organizing potential causes into categories and subcategories, the Fishbone diagram helps teams systematically explore and understand the various factors contributing to a problem. It is particularly useful in group discussions and problem-solving sessions, allowing teams to identify and prioritize the most significant contributors to a problem. The goal is to address these root causes effectively and implement preventive measures for continuous improvement.
Examples
Example in Manufacturing
Let’s consider an example of using a Fishbone diagram in Root Cause Analysis (RCA) to investigate the problem of “Late Delivery of Products” in a manufacturing company:
Problem Statement: Late Delivery of Products
Major Categories (Bones of the Fishbone Diagram):
- Methods
- Machines
- Materials
- Manpower (People)
- Measurement
- Environment
Branches (Subcategories):
- Methods:
- Inefficient production processes
- Lack of standardized procedures
- Machines:
- Equipment breakdowns
- Inadequate maintenance
- Materials:
- Shortage of raw materials
- Poor quality materials
- Manpower (People):
- Inadequate training
- High employee turnover
- Measurement:
- Inaccurate forecasting
- Ineffective tracking systems
- Environment:
- External factors (weather, transportation delays)
Contributing Factors (Sub-branches):
- Inefficient production processes:
- Lack of workflow optimization
- Bottlenecks in the production line
- Equipment breakdowns:
- Aging machinery
- Inadequate preventive maintenance schedule
- Shortage of raw materials:
- Inaccurate inventory management
- Supplier delays
- Inadequate training:
- Lack of onboarding programs
- Insufficient skill development opportunities
Root Causes: After analyzing the contributing factors listed in the Fishbone diagram, the team identifies the following root causes:
- Lack of workflow optimization leading to inefficiencies in production processes
- Inadequate preventive maintenance schedule resulting in equipment breakdowns
- Inaccurate inventory management causing shortages of raw materials
- Lack of comprehensive training programs contributing to workforce inefficiency
Corrective Actions: Based on the identified root causes, the team can develop targeted corrective actions such as:
- Implementing lean manufacturing principles to optimize workflows
- Establishing a proactive maintenance schedule for equipment
- Enhancing inventory management systems for better accuracy
- Investing in training and development programs for employees
Through this Fishbone analysis, the team gains a structured understanding of the various factors contributing to the problem of late product delivery and identifies actionable steps to address the root causes, ultimately improving the company’s delivery performance.
Example in Retail
Here is an example of using a Fishbone diagram in Root Cause Analysis (RCA) to investigate the problem of “High Rate of Customer Complaints” in a retail store:
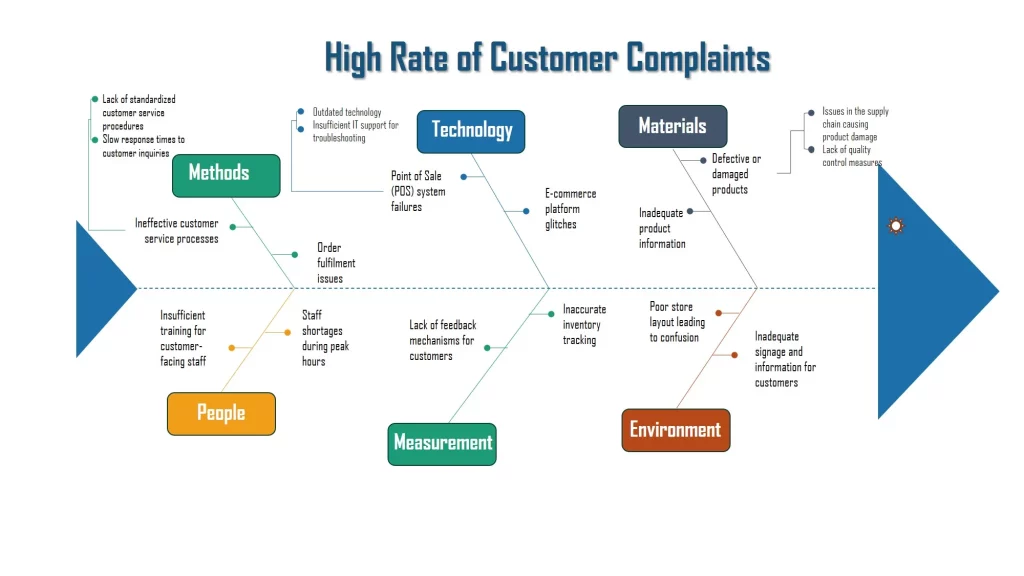
Problem Statement: High Rate of Customer Complaints
Major Categories (Bones of the Fishbone Diagram):
- Methods
- Machines (Technology)
- Materials
- Manpower (People)
- Measurement
- Environment (Physical and Store Environment)
Branches (Subcategories):
- Methods:
- Ineffective customer service processes
- Order fulfillment issues
- Machines (Technology):
- Point of Sale (POS) system failures
- E-commerce platform glitches
- Materials:
- Defective or damaged products
- Inadequate product information
- Manpower (People):
- Insufficient training for customer-facing staff
- Staff shortages during peak hours
- Measurement:
- Inaccurate inventory tracking
- Lack of feedback mechanisms for customers
- Environment (Physical and Store Environment):
- Poor store layout leading to confusion
- Inadequate signage and information for customers
Contributing Factors (Sub-branches):
- Ineffective customer service processes:
- Lack of standardized customer service procedures
- Slow response times to customer inquiries
- Point of Sale (POS) system failures:
- Outdated technology
- Insufficient IT support for troubleshooting
- Defective or damaged products:
- Issues in the supply chain causing product damage
- Lack of quality control measures
Root Causes: After analyzing the contributing factors listed in the Fishbone diagram, the team identifies the following root causes:
- Lack of standardized customer service procedures leading to inefficiencies
- Outdated technology in the POS system causing failures
- Issues in the supply chain contributing to defective or damaged products
Corrective Actions: Based on the identified root causes, the team can develop targeted corrective actions such as:
- Implementing standardized customer service training and procedures
- Upgrading the POS system to a more reliable and modern technology
- Strengthening quality control measures in the supply chain
Through this Fishbone analysis, the team gains insights into the multifaceted factors contributing to high customer complaints and can take specific actions to address the root causes, ultimately improving the overall customer experience in the retail store.
Example in Healthcare
Here is an example of using a Fishbone diagram in Root Cause Analysis (RCA) to investigate the problem of “Patient Falls” in a healthcare setting:
Problem Statement: Patient Falls
Major Categories (Bones of the Fishbone Diagram):
- Methods (Processes)
- Machines (Equipment)
- Materials (Supplies)
- Manpower (People)
- Measurement
- Environment (Physical Environment)
Branches (Subcategories):
- Methods (Processes):
- Lack of standardized patient assessment protocols
- Inadequate communication of patient risks
- Machines (Equipment):
- Malfunctioning or inadequate bed alarms
- Defective patient lifting equipment
- Materials (Supplies):
- Inadequate availability of non-slip footwear
- Poorly designed patient gowns contributing to tripping
- Manpower (People):
- Insufficient staffing levels for patient monitoring
- Lack of training on fall prevention strategies
- Measurement:
- Inaccurate recording and reporting of patient falls
- Lack of systematic analysis of fall incidents
- Environment (Physical Environment):
- Poor lighting in patient rooms
- Cluttered or obstructed pathways
Contributing Factors (Sub-branches):
- Lack of standardized patient assessment protocols:
- Inconsistent training on patient assessment procedures
- Incomplete documentation of patient risk factors
- Malfunctioning or inadequate bed alarms:
- Lack of routine equipment maintenance
- Insufficient staff training on alarm systems
Root Causes: After analyzing the contributing factors listed in the Fishbone diagram, the team identifies the following root causes:
- Inconsistent training on patient assessment procedures leading to inadequate risk identification
- Lack of routine maintenance for bed alarms causing malfunctions
Corrective Actions: Based on the identified root causes, the team can develop targeted corrective actions such as:
- Implementing standardized training programs for healthcare staff on patient assessment
- Establishing a routine maintenance schedule for bed alarms
- Enhancing communication protocols for patient risks
Through this Fishbone analysis, the healthcare team gains insights into the various factors contributing to patient falls and can implement specific actions to address the root causes, ultimately improving patient safety in the healthcare setting.
In conclusion, the key to a successful Fishbone analysis in Root Cause Analysis (RCA) is to have a clear problem definition, engage in thorough brainstorming with a diverse team, and organize potential causes into structured categories. This systematic approach facilitates a comprehensive exploration of contributing factors and helps identify root causes effectively.