
Financial analysis involves the use of various ratios to evaluate and interpret a company’s financial performance. These ratios are calculated by dividing one financial metric by another, providing insights into different aspects of a company’s operations, profitability, liquidity, solvency, and efficiency. Analysts, investors, and stakeholders use financial ratios to assess the financial health of a business and make informed decisions.
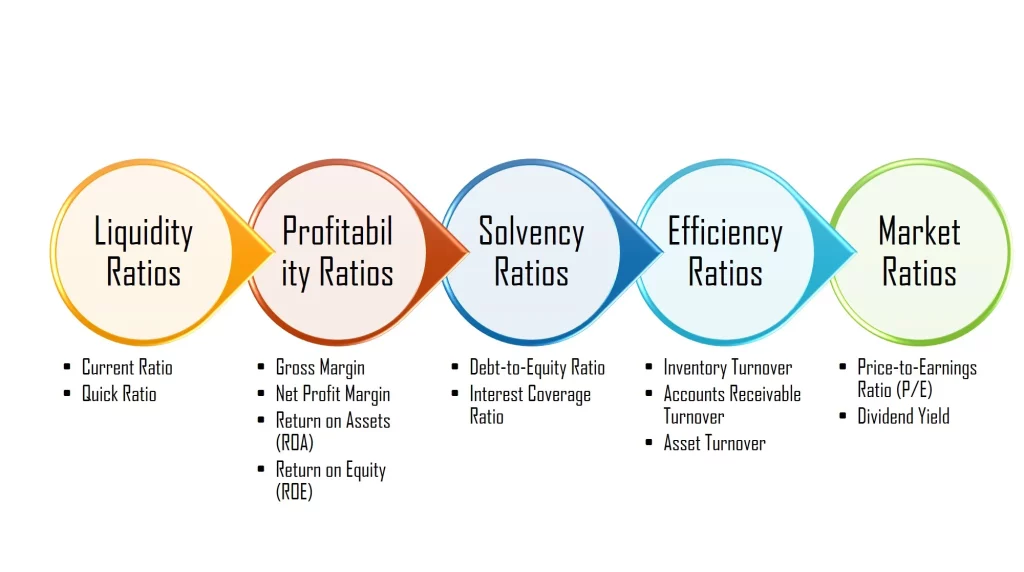
5 Common Classifications
- Liquidity Ratios:
- Profitability Ratios:
- Solvency Ratios:
- Efficiency Ratios:
- Market Ratios:
These ratios help analysts and investors assess a company’s financial position, operational efficiency, and overall performance in comparison to industry benchmarks or competitors. It’s essential to consider multiple ratios together and analyze trends over time to get a comprehensive understanding of a company’s financial health. Keep in mind that financial ratio analysis is just one tool in the broader scope of financial analysis, and it should be used in conjunction with other evaluation methods for a thorough assessment.
Liquidity Ratios
| Liquidity Ratio | Formula | Interpretation |
|---|---|---|
| Current Ratio | Current Assets / Current Liabilities | Indicates the company’s ability to cover short-term liabilities with its short-term assets. A ratio above 1 suggests the company can meet its short-term obligations. However, too high a ratio might indicate inefficient use of assets. A ratio below 1 may indicate potential liquidity issues. |
| Quick Ratio (Acid-Test) | (Current Assets – Inventory) / Current Liabilities | Similar to the current ratio but excludes inventory, which may not be easily convertible to cash. This ratio provides a more conservative measure of liquidity. A ratio above 1 suggests the company can meet its short-term obligations without relying on selling inventory. |
Profitability Ratios
| Profitability Ratio | Formula | Interpretation |
|---|---|---|
| Net Profit Margin | (Net Profit / Total Revenue) * 100 | Represents the percentage of profit earned per dollar of revenue. A higher margin indicates better profitability. |
| Return on Assets (ROA) | (Net Income / Average Total Assets) * 100 | Measures the efficiency of using assets to generate profit. A higher ROA indicates more efficient asset utilization. |
| Return on Equity (ROE) | (Net Income / Average Shareholders’ Equity) * 100 | Indicates the return generated for each dollar of shareholders’ equity. Higher ROE suggests effective use of equity capital. |
| Gross Margin | [(Total Revenue – Cost of Goods Sold) / Total Revenue] * 100 | Represents the percentage of revenue retained after covering the cost of goods sold. Higher gross margins indicate better profitability. |
Solvency Ratios
| Solvency Ratio | Formula | Interpretation |
|---|---|---|
| Debt-to-Equity Ratio | Total Debt / Shareholders’ Equity | Indicates the proportion of a company’s financing that comes from debt compared to equity. A higher ratio may suggest higher financial risk, but it depends on industry norms and the company’s risk tolerance. |
| Interest Coverage Ratio | Earnings Before Interest and Taxes (EBIT) / Interest Expense | Measures a company’s ability to cover its interest obligations with operating earnings. Higher values suggest better ability to meet interest payments. |
Efficiency Ratios
| Efficiency Ratio | Formula | Interpretation |
|---|---|---|
| Inventory Turnover | Cost of Goods Sold / Average Inventory | Measures how many times a company’s inventory is sold and replaced over a period. Higher turnover is generally favorable, indicating efficient inventory management. |
| Accounts Receivable Turnover | Net Credit Sales / Average Accounts Receivable | – Net Credit Sales represent the total sales made on credit (excluding cash sales) during a given period.
– Average Accounts Receivable is the average value of accounts receivable during the same period. Assesses how efficiently a company manages its receivables or the credit it extends to its customers. Measures how many times a company collects its average accounts receivable balance during a period. Higher turnover suggests effective credit and collection policies. |
| Asset Turnover | Net Sales / Average Total Assets | Assesses how efficiently a company uses its assets to generate revenue. Higher asset turnover indicates better utilization of assets to generate sales or revenue. |
Market Ratios
| Market Ratio | Formula | Interpretation |
|---|---|---|
| Price-to-Earnings Ratio (P/E) | Market Price per Share / Earnings per Share | Measures the market’s expectations for a company’s future earnings growth. A higher P/E ratio may indicate higher growth expectations but could also imply an overvalued stock. |
| Dividend Yield | (Annual Dividend per Share / Market Price per Share) * 100 | Represents the percentage of a company’s stock price returned to shareholders as dividends. A higher yield may be attractive to income-focused investors. |
Examples
Apple Inc. Financial Ratios FY23
| Liquidity Ratio | Calculations (Millions of USD) | Interpretation |
|---|---|---|
| Current Ratio | = Current Assets / Current Liabilities
= 143566/145308 =0.99 |
Apple Inc.’s current ratio of 0.99 (FY23) suggests that the company may have a relatively tight liquidity position, as its current assets are almost equal to its current liabilities. |
| Quick Ratio (Acid-Test) | = (Current Assets – Inventory) / Current Liabilities
= (143566 – 6331)/145308 = 0.94 |
A quick ratio of 0.94 means that for every dollar of current liabilities, the company has $0.90 in quick assets (cash, cash equivalents, short-term investments, and accounts receivable) available to cover those obligations. This suggests that Apple Inc. may have difficulty meeting its short-term obligations if they all come due at once. |
| Profitability Ratio | Calculations (Millions of USD) | Interpretation |
|---|---|---|
| Net Profit Margin | = (Net Profit / Total Revenue) * 100
= (96995 / 383285) * 100 = 25.31% |
Apple Inc. retained 25.31% of its total revenue as profit after covering all costs and expenses in the financial year 2023. |
| Return on Assets (ROA) | = (Net Income / Average Total Assets) * 100
= (96995 / 352583 ) * 100 = 27.51% |
Apple Inc.’s ROA of 27.51% is considered quite high and suggests that the company is efficient in utilizing its assets to generate profits. It indicates that the company is earning a substantial return relative to its asset base. |
| Return on Equity (ROE) | = (Net Income / Average Shareholders’ Equity) * 100
= (96995 / 62146 ) * 100 = 156.08% |
Apple Inc.’s ROE of 156.08% is very high and indicates that the company is delivering strong returns to its shareholders in proportion to their equity investment. It suggests that the company is effectively using equity capital to generate profits. |
| Gross Margin | = [(Total Revenue – Cost of Goods Sold) / Total Revenue] * 100
= [(383285 – 214137)/ 383285 ] * 100 = 44.13% |
Apple Inc.’s gross margin of 44.13% means that the company retains 44.13 cents as gross profit for every dollar of revenue after accounting for the direct costs of producing goods or services. Generally, such a high gross margin is considered favorable, as it indicates that a larger portion of revenue is available to cover operating expenses and contribute to net profit. |
| Solvency Ratio | Calculations (Millions of USD) | Interpretation |
|---|---|---|
| Debt-to-Equity Ratio | = Total Debt / Shareholders’ Equity
= 290437 / 62146 = 4.67 |
Apple’s debt-to-equity ratio of 4.67 means that for every dollar of equity, the company has $4.67 in debt. The company has a relatively high level of debt compared to its equity. This indicates a higher degree of financial leverage, meaning the company relies more on borrowed funds to finance its operations and investments. While financial leverage can amplify returns in good times, it also increases the risk, especially if the company faces challenges in meeting its debt obligations. |
| Interest Coverage Ratio | = Earnings Before Interest and Taxes (EBIT) / Interest Expense
= 114301 / 3933 =29.06 |
Apple Inc.’s interest coverage ratio of 29.06 is generally considered quite high and suggests that the company has a comfortable margin to meet its interest obligations. A higher interest coverage ratio indicates that the company has a greater ability to service its debt from its operating income. It is a positive signal to creditors and investors, as it implies lower financial risk related to the company’s ability to meet its interest payments. |
| Efficiency Ratio | Calculations (Millions of USD) | Interpretation |
|---|---|---|
| Inventory Turnover | = Cost of Goods Sold / Average Inventory
= 214137 / 6331 = 33.82 |
An inventory turnover of 33.82 means that, on average, Apple Inc. sold and replaced its entire inventory 33.82 times during the FY23. A high inventory turnover is generally considered positive because it indicates that the company is efficiently managing its inventory. It suggests that the company is selling products quickly, minimizing holding costs, and potentially generating cash flow more rapidly. |
| Accounts Receivable Turnover | = Net Credit Sales / Average Accounts Receivable
= 383309 / 29508 =12.99 |
Apple Inc., on average, collects its accounts receivable nearly 13 times per year. This high turnover ratio generally indicates that the company is efficient in managing its receivables, collecting payments promptly, and converting credit sales into cash quickly. |
| Asset Turnover | = Net Sales / Average Total Assets
= 383285 / 352583 = 1.09 |
Apple Inc.’s 2023 asset turnover ratio of 1.09 suggests that it is generating sales roughly equivalent to its average total assets. This ratio suggests moderate efficiency in using assets to generate revenue. |
| Market Ratio | Calculations | Interpretation |
|---|---|---|
| Price-to-Earnings Ratio (P/E) | = Market Price per Share / Earnings per Share
= 170.98 / 6.13 = 27.9 |
Apple Inc.’s P/E ratio of 27.9 indicates that investors are willing to pay $27.9 for every dollar of earnings generated by the company. It suggests that investors have high expectations for the company’s future earnings growth and prospects. |
| Dividend Yield | = (Annual Dividend per Share / Market Price per Share) * 100
= (0.96 / 177.58) *100 = 0.54% |
Apple’s 2023 annual dividend yield of 0.54% suggests that investors can expect to receive an annual dividend payment equal to 0.54% of the current market price of one share of the stock. The investment provides a relatively modest income in the form of dividends compared to the current market price. |
Amazon Inc. Financial Ratios (FY2023)
| Liquidity Ratio | Calculations (Millions of USD) | Interpretation |
|---|---|---|
| Current Ratio | = Current Assets / Current Liabilities
= 172351/164917 =1.05 |
Amazon Inc.’s current ratio of 1.05 (FY23) implies that the company can meet its short-term obligations. |
| Quick Ratio (Acid-Test) | = (Current Assets – Inventory) / Current Liabilities
= (172351 – 33318)/164917 = 0.84 |
Amazon Inc.’s quick ratio of 0.84 implies that the company may experience difficulties meeting short-term obligations if they are due at once. |
| Profitability Ratio | Calculations (Millions of USD) | Interpretation |
|---|---|---|
| Net Profit Margin | = (Net Profit / Total Revenue) * 100
= (30425 / 574785) * 100 = 5.29% |
Amazon Inc. retained 5.29% of its total revenue as income/profit after covering all costs and expenses in the financial year 2023. |
| Return on Assets (ROA) | = (Net Income / Average Total Assets) * 100
= (30425 / 527854 ) * 100 = 5.76% |
Amazon Inc.’s ROA of 5.76% implies that the company is generating a profit of 5.76 cents for every dollar of average total assets. This is a reasonable level of profitability relative to its asset base. |
| Return on Equity (ROE) | = (Net Income / Average Shareholders’ Equity) * 100
= (30425 / 201875 ) * 100 = 15.07% |
Amazon Inc.’s ROE of 15.07% indicates that the company is generating a profit of 15.07 cents for every dollar of shareholders’ equity. While favorable, a higher ROE is preferable. |
| Gross Margin | = [(Total Revenue – Cost of Goods Sold) / Total Revenue] * 100
= [(574785 – 304739)/ 574785] * 100 = 46.98% |
Amazon Inc.’s gross margin of 46.98% implies that the company retains 46.98 cents as gross profit for every dollar of revenue after subtracting the cost of goods sold (COGS). This percentage represents the portion of sales revenue that contributes to covering operating expenses and generating profit before other expenses are considered. A higher gross margin is generally favorable, as it indicates better profitability at the gross profit level. |
| Solvency Ratio | Calculations (Millions of USD) | Interpretation |
|---|---|---|
| Debt-to-Equity Ratio | = Total Debt / Shareholders’ Equity
= 325979 / 201875 = 1.61 |
Amazon’s debt-to-equity ratio of 1.61 implies that, for every dollar of shareholders’ equity, the company has $1.61 in total debt. This ratio measures the proportion of a company’s financing that comes from debt compared to equity. A debt-to-equity ratio of 1.61 suggests a relatively higher level of financial leverage, meaning the company relies more on borrowed funds to finance its operations and investments. While a higher ratio can amplify returns, it also increases financial risk, as the company has higher debt obligations to fulfill. |
| Interest Coverage Ratio | = Earnings Before Interest and Taxes (EBIT) / Interest Expense
= 40739 / 3182 = 12.8 |
Amazon’s interest coverage ratio of 12.8 implies that the company’s operating income is 12.8 times the amount of its interest expenses. This ratio assesses the company’s ability to cover its interest obligations with its operating income. Amazon’s high interest coverage ratio indicates a comfortable margin, suggesting that the company has a strong ability to meet its interest payments. This is generally seen as positive, as it implies lower financial risk related to the company’s ability to service its debt. |
| Efficiency Ratio | Calculations (Millions of USD) | Interpretation |
|---|---|---|
| Inventory Turnover | = Cost of Goods Sold / Average Inventory
= 304739 / 33318 = 9.15 |
Amazon Inc.’s inventory turnover of 9.15 implies that, on average, the company sells and replaces its entire inventory 9.15 times during the specified period. This ratio measures the efficiency of inventory management, with a higher turnover indicating that the company is selling its products quickly. A turnover of 9.15 suggests effective utilization of inventory and efficient sales processes. |
| Accounts Receivable Turnover | = Net Credit Sales / Average Accounts Receivable
= 574785 / 34100 = 16.86 |
Amazon Inc.’s accounts receivable turnover of 16.86 implies that, on average, the company collects its accounts receivable 17 times during the FY2023. This ratio measures how efficiently the company manages its receivables, with a higher turnover suggesting prompt and effective collections. A turnover of 16.86 indicates strong efficiency in converting credit sales into cash. |
| Asset Turnover | = Net Sales / Average Total Assets
= 574785 / 527854 = 1.09 |
Amazon Inc.’s has an asset turnover ratio of 1.09 in FY2023, indicating that the company is generating sales roughly equivalent to its average total assets. This ratio suggests moderate efficiency in using assets to generate revenue. |
| Market Ratio | Calculations | Interpretation |
|---|---|---|
| Price-to-Earnings Ratio (P/E) | = Market Price per Share / Earnings per Share
= 115.9 / 1.93 = 60.05 |
Amazon’s price-to-earnings (P/E) ratio of 60.05 implies that the current market price of one share of the company’s stock is 60.05 times its earnings per share (EPS). The company’s high P/E ratio indicates that investors have high expectations for the company’s future earnings growth, and there is optimism about its prospects. |
| Dividend Yield | = (Annual Dividend per Share / Market Price per Share) * 100
= (0 / 115.9) *100 = 0.00% |
Amazon Inc. has never provided dividends to its shareholders. |
In conclusion, the key to conducting successful financial ratio analysis is a comprehensive and contextual understanding of the company’s financial statements, utilizing relevant ratios to assess its performance, financial health, and operational efficiency, while considering industry benchmarks and historical trends.