
Cash flow statement analysis involves the examination and interpretation of a company’s cash flow statement, one of the three main financial statements. The cash flow statement provides insights into how cash is generated and used by a company during a specific period. It is divided into three sections: operating activities, investing activities, and financing activities.
3 Key Aspects
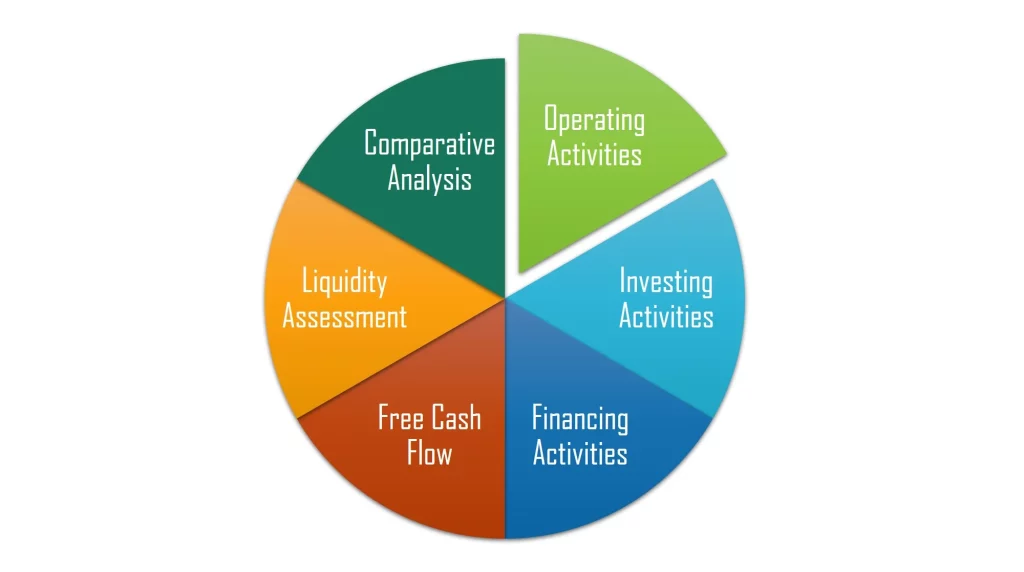
- Operating Activities:
- Investing Activities:
- Financing Activities:
Key Activities
| Activity | Specifics & Examples | Interpretation |
|---|---|---|
| Operating Activities | Specifics: Cash flows from day-to-day business operations.
Examples: Receipts from customers, payments to suppliers and employees. |
– Positive operating cash flow indicates operational health.
– Negative operating cash flow may signal challenges in generating cash from core operations. |
| Investing Activities | Specifics: Cash flows related to investments in long-term assets.
Examples: Purchase/sale of property, plant, equipment, and investments. |
– Positive cash flow from investing activities suggests sound investment decisions.
– Negative cash flow may indicate capital expenditures or asset acquisitions. |
| Financing Activities | Specifics: Cash flows from raising or repaying capital and returning value to shareholders.
Examples: Debt issuance/repayment, dividend payments, stock repurchases. |
– Positive cash flow from financing activities may indicate capital infusion or debt reduction.
– Negative cash flow may indicate dividend payments or share repurchases. |
| Liquidity Assessment | Specifics: Overall impact on cash and cash equivalents, including changes in working capital.
Examples: Change in current assets and liabilities. |
– Positive impact enhances liquidity and working capital.
– Negative impact may raise concerns about liquidity management. |
| Free Cash Flow | Specifics: Cash available after operating expenses and capital expenditures.
Calculation: Operating Cash Flow + Interest Expense + Tax Shield on Interest Expense – Capital Expenditures. |
Positive free cash flow can be used for dividends, debt reduction, or investments. |
| Trend Analysis | Comparing cash flow statements over multiple periods. | Identifying trends aids in understanding changes in the company’s cash position. |
| Comparative Analysis | Benchmarking cash flow performance against industry peers. | Understanding relative standing in the industry for cash flow efficiency. |
Example: Walmart Cash Flow Statement Analysis (2020 – 2023)
| Activity | 2020 | 2021 | 2022 | 2023 |
|---|---|---|---|---|
| Net Income | 15201 | 13510 | 13673 | 11680 |
| Operating Activities | 25255 | 36074 | 24181 | 28841 |
| Investing Activities | -9128 | -10071 | -6015 | -17722 |
| Financing Activities | -14299 | -16117 | -22828 | -17039 |
| Net Change in Cash | 1759 | 8273 | -2954 | -5993 |
| Capital Expenditures | -10705 | -10264 | -13106 | -16857 |
| Interest Expense (Income) | -2410 | -2194 | -1836 | – |
| Free Cash Flow | 16960 | 28004 | 12911 | 11984 |
This data on Walmart Inc.’s cash flow statement for the years 2020 to 2023 provides insights into the company’s cash flow dynamics:
- Operating Activities and Net Income:
- Investing Activities and Net Income:
- Financing Activities and Net Income:
- Net Change in Cash:
- Free Cash Flow:
- Cash Flow Analysis:
Tips
- Focus on Operating Cash Flow: Place a significant emphasis on the operating cash flow section. It provides insights into the company’s ability to generate cash from its core business operations.
- Assess the Quality of Earnings: Examine the relationship between net income and operating cash flow. A positive operating cash flow that aligns with net income indicates healthy earnings quality.
- Evaluate Liquidity Position: Using financial ratios, analyze changes in working capital components, such as accounts receivable, inventory, and accounts payable, to assess the company’s liquidity position.
- Understand Investing Activities: Assess the company’s investment decisions by examining cash flows related to the acquisition and disposal of long-term assets. Positive investing cash flows may indicate strategic investments.
- Examine Financing Activities: Evaluate the company’s financing decisions by analyzing cash flows related to debt, dividends, and equity transactions. It provides insights into capital structure management and shareholder value.
- Calculate and Analyze Free Cash Flow: Compute free cash flow to understand the amount of cash available after covering operating expenses and capital expenditures. Positive free cash flow can be used for dividends, debt reduction, or investments.
- Consider Trends Over Time: Conduct trend analysis by comparing cash flow statements over multiple periods. Identifying consistent trends helps in understanding the company’s cash flow trajectory.
- Look for Consistency with Industry Benchmarks: Compare the company’s cash flow performance with industry averages or competitors. This provides context and helps assess relative standing.
- Assess Cash Conversion Cycle: Calculate and analyze the cash conversion cycle to understand how efficiently the company converts investments in inventory and receivables into cash.
- Evaluate Cash Flow Adequacy: Consider whether the operating cash flow is sufficient to cover capital expenditures, debt obligations, and dividend payments. This evaluation ensures the company’s financial sustainability.
- Scrutinize Non-Operating Cash Flows: Pay attention to non-operating cash flows, such as those related to extraordinary items or one-time events. Understand their impact on overall cash flow.
- Consider External Factors: Take into account external factors, economic conditions, or industry trends that may influence the company’s cash flow performance.
- Review Disclosures and Footnotes: Read accompanying disclosures and footnotes to gain additional context on accounting policies, assumptions, and potential risks.
- Seek Clarifications if Needed: If uncertainties or complexities arise, don’t hesitate to seek clarifications from financial statements, management, or other reliable sources.
In conclusion, the key to conducting a successful cash flow statement analysis is to focus on cash flows from operating, investing, and financing activities, assess the quality of earnings by comparing net income to cash flow activities, and consider trends over time, ensuring a thorough evaluation of a company’s liquidity, investment decisions, and financing activities.