
Business process analysis (BPA) is a methodology used by organizations to understand, evaluate, and improve their business processes. It involves the systematic examination and documentation of processes to identify inefficiencies, bottlenecks, and areas for improvement. The goal is to enhance the overall efficiency, effectiveness, and performance of the organization.
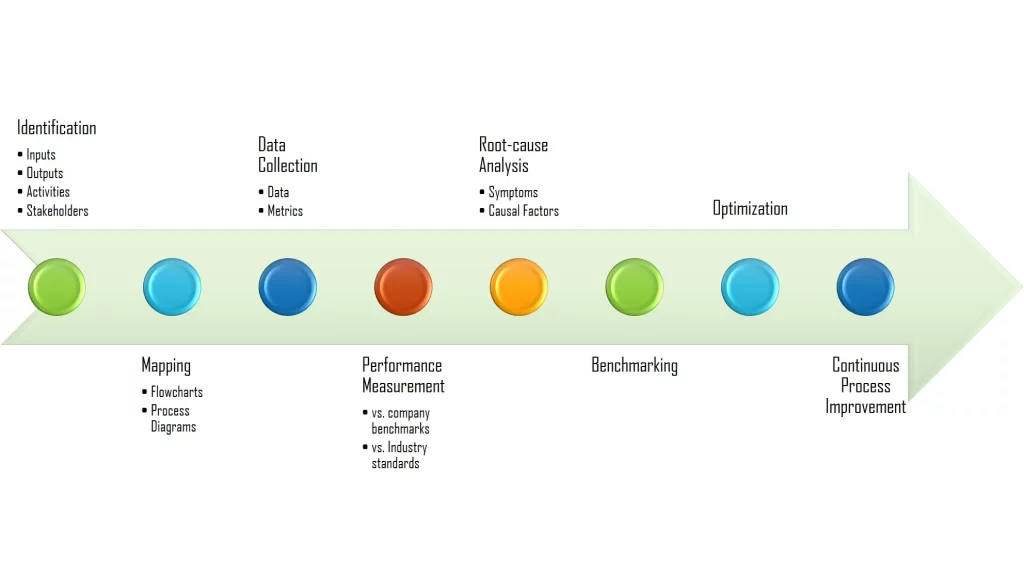
Key Components
- Process Identification:
- Process Mapping:
- Data Collection:
- Performance Measurement:
- Root Cause Analysis:
- Benchmarking:
- Optimization:
- Continuous Process Improvement:
Business process analysis can be applied across various functional areas within an organization, such as finance, human resources, manufacturing, and customer service. It is a valuable tool for organizations seeking to streamline operations, enhance customer satisfaction, and stay competitive in a dynamic business environment.
Business Process Analysis Example: Amazon Inc.
A. Process Identification
| Aspect | Specifics |
|---|---|
| Process Identification: | Order Fulfillment at Amazon |
| Process Name: | Order Fulfillment |
| Objective: | To efficiently process customer orders and deliver products to customers within the promised timeframe. |
| Description: | This process involves receiving customer orders, picking items from the inventory, packing them securely, and shipping them to the customer’s address. It also includes order verification, payment processing, and updating order status. |
| Key Activities: | 1. Receiving Orders: Orders are received through Amazon’s website or mobile app. 2. Inventory Management: Checking the availability of items in the inventory. 3. Order Picking: Selecting items from the inventory to fulfill each order. 4. Packing: Securely packaging items to ensure safe delivery. 5. Shipping: Dispatching orders through various carriers (e.g., UPS, FedEx) for delivery. 6. Order Verification: Ensuring accuracy and completeness of orders before shipment. 7. Payment Processing: Charging customers for their orders and processing payments securely. 8. Order Status Updates: Updating customers on the status of their orders, including tracking information. |
| Stakeholders: | – Customers: Placing orders and receiving deliveries. – Warehouse Staff: Handling inventory, picking, and packing orders. – Logistics Team: Managing shipping and delivery processes. – Customer Service: Addressing customer inquiries and issues related to orders. |
| Inputs: | – Customer Orders – Inventory Data – Payment Information |
| Outputs: | – Shipped Orders – Order Status Updates – Payment Confirmations |
| Systems Used: | – Amazon’s Website and Mobile App – Inventory Management System – Payment Processing System – Shipping and Logistics Systems |
| Performance Metrics: | – Order Processing Time – Order Accuracy – On-time Delivery Rate – Customer Satisfaction |
B. Process Mapping
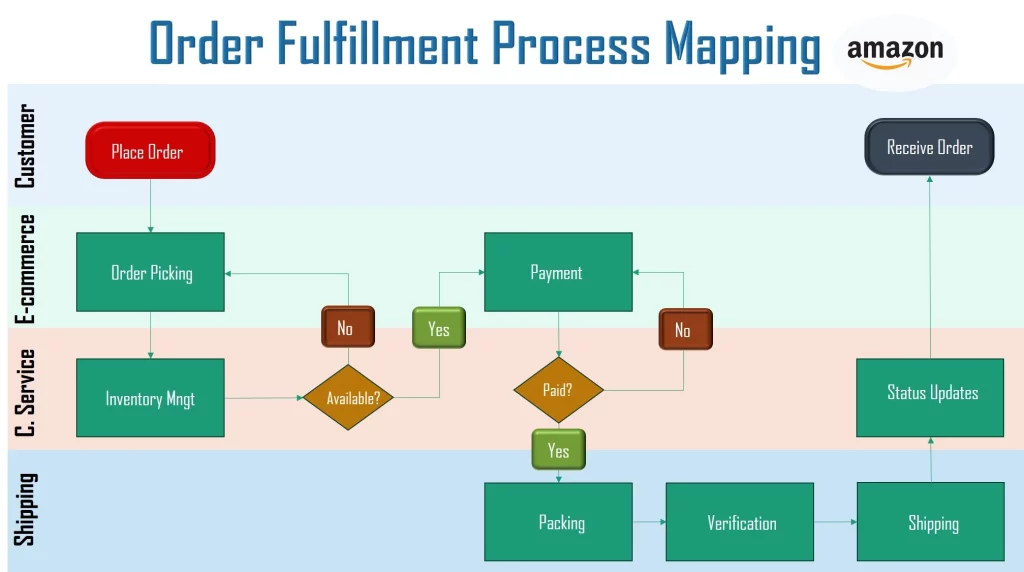
Notes:
C. Data Collection: Order Fulfillment at Amazon
| Data Type | Data Collection Method | Specifics |
|---|---|---|
| Order Processing Time | Automated system timestamps | Measure the time taken from order placement to shipping confirmation. Track average processing time for different product categories. |
| Order Accuracy | Quality checks and audits | Conduct regular audits to compare the items picked and packed with the customer’s order. Record instances of accurate and inaccurate order fulfillment. |
| On-time Delivery Rate | Shipping system timestamps | Monitor the time between order shipment and actual delivery. Calculate the percentage of orders delivered on time. |
| Customer Satisfaction | Surveys and feedback mechanisms | Collect customer feedback through post-purchase surveys or reviews. Measure satisfaction with the order fulfillment process. |
| Inventory Accuracy | RFID or barcode scans | Use technology to track the accuracy of inventory levels. Compare system records with physical counts to identify discrepancies. |
| Payment Processing Time | Payment system timestamps | Measure the time taken from order placement to successful payment processing. Evaluate average payment processing times for different payment methods. |
| Order Status Update Timeliness | System-generated timestamps | Monitor the timeliness of updates to customers on order status. Record the time taken to communicate any changes in the order’s journey. |
| Resource Utilization (Warehouse Staff) | Time tracking systems | Track the time spent by warehouse staff on each step of the order fulfillment process. Evaluate resource efficiency and identify potential bottlenecks. |
| Shipping Costs vs. Budget | Financial records and reports | Compare actual shipping costs against the budget allocated for shipping. Identify areas where costs can be optimized. |
| Return Rate | Returns processing system | Monitor the percentage of orders that result in returns. Analyze reasons for returns to improve product descriptions or packaging. |
D. Performance Measurement: Order Fulfillment at Amazon
| Performance Metric | Calculation Method | Target/Threshold | Monitoring Frequency |
|---|---|---|---|
| Order Processing Time | Time taken from order placement to shipping confirmation. | Average processing time per order. | Weekly |
| Order Accuracy | Percentage of accurately fulfilled orders. | 98% accuracy rate. | Monthly |
| On-time Delivery Rate | Percentage of orders delivered on time. | 95% on-time delivery rate. | Daily |
| Customer Satisfaction | Customer feedback scores from post-purchase surveys. | Maintain a satisfaction score above 4.5 out of 5. | Monthly |
| Inventory Accuracy | Discrepancy rate between system records and physical inventory counts. | Maintain a discrepancy rate below 2%. | Quarterly |
| Payment Processing Time | Time taken from order placement to successful payment processing. | Average payment processing time per order. | Weekly |
| Order Status Update Timeliness | Time taken to update customers on order status changes. | 95% of updates within 24 hours. | Daily |
| Resource Utilization (Warehouse Staff) | Time spent by warehouse staff on order fulfillment. | Optimize time allocation for different tasks. | Monthly |
| Shipping Costs vs. Budget | Comparison of actual shipping costs against the budget. | Keep shipping costs within 5% of the budget. | Quarterly |
| Return Rate | Percentage of orders that result in returns. | Maintain a return rate below 5%. | Monthly |
E. Root Cause Analysis: Order Fulfillment at Amazon
| Issue/Challenge | Possible Root Causes | Investigation Methods | Corrective Actions |
|---|---|---|---|
| 1. High Order Processing Time | – Inefficient order picking and packing processes.
– Overloaded inventory management system. |
– Time-motion studies to analyze staff movements.
– System performance analysis. |
– Implement automated picking systems.
– Upgrade inventory management software for scalability. |
| 2. Order Accuracy Issues | – Lack of employee training.
– Inadequate quality checks in the packing process. |
– Employee performance evaluations and feedback.
– Inspection of packing processes. |
– Enhance employee training programs.
– Implement additional quality control checkpoints. |
| 3. On-time Delivery Challenges | – Inefficient routing and scheduling of shipments.
– Unpredictable carrier delays. |
– Analysis of historical shipment data.
– Collaboration with carriers to address delays. |
– Optimize shipment routes and schedules.
– Negotiate service-level agreements with carriers. |
| 4. Low Customer Satisfaction Scores | – Poor communication on order status.
– Consistent product quality issues. |
– Customer feedback analysis.
– Product quality assessments. |
– Implement real-time order tracking.
– Strengthen quality control measures. |
| 5. Inventory Inaccuracy | – Manual errors in inventory counts.
– System glitches leading to discrepancies. |
– Physical inventory audits.
– System performance testing. |
– Implement regular cycle counts.
– Invest in system upgrades and maintenance. |
| 6. Payment Processing Delays | – Integration issues with payment systems.
– Manual errors in payment verification. |
– IT system integration reviews.
– Transaction log analysis. |
– Enhance payment system integrations.
– Implement additional verification checks. |
| 7. Timeliness of Order Status Updates | – Lack of automated update mechanisms.
– Communication breakdowns between systems. |
– System performance analysis.
– Process mapping to identify communication points. |
– Implement automated status update notifications.
– Enhance integration between systems. |
| 8. Suboptimal Resource Utilization | – Inefficient warehouse layout.
– Inadequate workload distribution. |
– Warehouse layout assessments.
– Time-motion studies for workload distribution. |
– Optimize warehouse layout for efficiency.
– Implement workload balancing mechanisms. |
| 9. Exceeding Shipping Budget | – Inaccurate cost estimations.
– Suboptimal negotiation with carriers. |
– Cost breakdown analysis.
– Carrier negotiation process review. |
– Implement more accurate cost estimation models.
– Strengthen negotiation strategies with carriers. |
| 10. High Return Rate | – Inaccurate product descriptions.
– Quality issues with packaging. |
– Product content review.
– Return reason analysis. |
– Improve product descriptions for clarity.
– Enhance packaging quality control measures. |
F. Benchmarking: Order Fulfillment at Amazon
| Performance Metric | Amazon’s Performance | Benchmark/Industry Standard | Observations/Gap Analysis |
|---|---|---|---|
| Order Processing Time | Average processing time per order: 24 hours. | Industry standard: 18 hours. | Amazon’s processing time is slightly higher than the industry standard, indicating a potential area for improvement. |
| Order Accuracy | Accuracy rate: 97%. | Benchmark: 98%. | Amazon’s accuracy rate is slightly below the benchmark, suggesting a need for enhanced quality control measures. |
| On-time Delivery Rate | On-time delivery rate: 92%. | Industry standard: 95%. | Amazon’s on-time delivery rate is below the industry standard, highlighting a need to address potential delays in the fulfillment process. |
| Customer Satisfaction | Customer satisfaction score: 4.6 out of 5. | Benchmark: 4.8 out of 5. | While Amazon’s score is high, there is a slight gap compared to the benchmark, indicating room for improvement to match top performers. |
| Inventory Accuracy | Discrepancy rate: 1.5%. | Industry standard: 1%. | Amazon’s inventory accuracy is close to the industry standard, but there is a slight gap that may be addressed for optimization. |
| Payment Processing Time | Average payment processing time: 2 hours. | Best-in-class benchmark: 1 hour. | Amazon’s payment processing time is slightly higher than the best-in-class benchmark, suggesting an opportunity for streamlining. |
| Order Status Update Timeliness | 90% of updates within 24 hours. | Best practice: 95% within 24 hours. | Amazon’s timeliness in updating order statuses is slightly below best practice, indicating room for improvement in communication efficiency. |
| Resource Utilization (Warehouse Staff) | Overall efficiency rating: 85%. | Best practice: 90%. | Amazon’s warehouse staff utilization is below best practice, signaling an opportunity to optimize resource allocation. |
| Shipping Costs vs. Budget | Shipping cost variance: 7%. | Best practice: 5%. | Amazon’s shipping costs exceed the best practice benchmark, suggesting potential cost optimization strategies. |
| Return Rate | Return rate: 4%. | Industry standard: 3%. | While Amazon’s return rate is relatively low, there is a slight gap compared to the industry standard, signaling an area for further improvement. |
G. Optimization
| Optimization Area | Specific Changes | Expected Benefits | Implementation Timeline |
|---|---|---|---|
| Order Processing Time | Implement automated picking systems. | – Reduction in order processing time by 20%. | 6 months |
| Order Accuracy | Enhance employee training programs. Implement additional quality control checkpoints. | – Increase in order accuracy rate to 99%. | 3 months |
| On-time Delivery Rate | Optimize shipment routes and schedules. Negotiate service-level agreements with carriers. | – Improvement in on-time delivery rate to 96%. | 6 months |
| Customer Satisfaction | Implement real-time order tracking. Strengthen quality control measures. | – Increase in customer satisfaction score to 4.8 out of 5. | 4 months |
| Inventory Accuracy | Implement regular cycle counts. Invest in system upgrades and maintenance. | – Reduction in inventory discrepancy rate to 1%. | 5 months |
| Payment Processing Time | Enhance payment system integrations. Implement additional verification checks. | – Reduction in payment processing time to 1.5 hours. | 4 months |
| Order Status Update Timeliness | Implement automated status update notifications. Enhance integration between systems. | – Increase in the percentage of updates within 24 hours to 95%. | 3 months |
| Resource Utilization (Warehouse Staff) | Optimize warehouse layout for efficiency. Implement workload balancing mechanisms. | – Increase in overall efficiency rating to 92%. | 6 months |
| Shipping Costs vs. Budget | Implement more accurate cost estimation models. Strengthen negotiation strategies with carriers. | – Reduction in shipping cost variance to 5%. | 5 months |
| Return Rate | Improve product descriptions for clarity. Enhance packaging quality control measures. | – Reduction in return rate to 3%. | 4 months |
H. Continuous Improvement: Order Fulfillment at Amazon
| Improvement Area | Continuous Improvement Initiatives | Expected Outcomes | Review Frequency |
|---|---|---|---|
| Order Processing Time | Implement real-time monitoring of order processing stages. Regularly review and optimize automated picking algorithms. | – Further reduction in order processing time. | Monthly |
| Order Accuracy | Conduct regular training sessions for warehouse staff. Analyze returned orders for common inaccuracies and adjust quality control measures. | – Gradual increase in order accuracy rate. | Quarterly |
| On-time Delivery Rate | Analyze historical data to predict peak delivery times and adjust staffing levels. Continuously negotiate with carriers for better service agreements. | – Consistent improvement in on-time delivery performance. | Monthly |
| Customer Satisfaction | Gather and analyze customer feedback on a real-time basis. Implement targeted improvements based on feedback trends. | – Sustained increase in customer satisfaction scores. | Weekly |
| Inventory Accuracy | Implement a continuous cycle counting process. Regularly review and update inventory management system algorithms. | – Steady reduction in inventory discrepancy rate. | Monthly |
| Payment Processing Time | Monitor payment system performance and identify bottlenecks. Implement real-time transaction monitoring for immediate issue resolution. | – Continuous reduction in payment processing time. | Weekly |
| Order Status Update Timeliness | Monitor system integration points and address any delays promptly. Implement automated alerts for potential communication breakdowns. | – Consistent improvement in update timeliness. | Weekly |
| Resource Utilization (Warehouse Staff) | Implement a feedback mechanism for staff to suggest process improvements. Regularly review warehouse layout for additional optimization opportunities. | – Incremental increases in overall efficiency. | Monthly |
| Shipping Costs vs. Budget | Implement ongoing cost analysis to identify additional cost-saving opportunities. Regularly review carrier agreements and negotiate updated terms. | – Continuous reduction in shipping cost variance. | Quarterly |
| Return Rate | Analyze return reasons and address common product issues. Regularly update product descriptions for clarity. | – Gradual decrease in return rate. | Monthly |
FAQs
-
Why is business process analysis important for organizations?
Business process analysis is crucial for organizations because it allows them to:
- Identify Inefficiencies: BPA helps organizations pinpoint inefficiencies, redundancies, and bottlenecks within their processes.
- Enhance Efficiency: By understanding and optimizing workflows, organizations can streamline operations, reducing costs and improving overall efficiency.
- Improve Customer Satisfaction: BPA enables organizations to align processes with customer needs, enhancing service quality and satisfaction.
- Facilitate Strategic Decision-Making: Understanding and analyzing business processes provides valuable insights for strategic decision-making, resource allocation, and long-term planning.
- Adapt to Change: BPA allows organizations to adapt to changes in the business environment, technology, and customer expectations by continuously improving processes.
-
How is process mapping different from process modeling in business process analysis?
- Process Mapping: This involves creating visual representations (like flowcharts or diagrams) of the steps in a process. Process mapping provides a clear and detailed view of the sequence of activities, decisions, and interactions within a process.
- Process Modeling: Process modeling is a broader term that encompasses various methods of representing processes, including graphical models like process maps, but also textual descriptions, mathematical models, or simulations. It involves a more comprehensive and abstract representation of a process, often focusing on the flow of data, resources, and decisions.
In essence, process mapping is a specific technique within the broader category of process modeling.
-
What tools are commonly used in business process analysis?
Common tools used in business process analysis include:
- Flowcharts and Diagrams: Used for process mapping and visualization.
- Process Modeling Software: Tools like Microsoft Visio, Lucidchart, or Bizagi facilitate detailed process modeling.
- Workflow Automation Tools: Such as Microsoft Power Automate or Zapier to automate routine tasks within processes.
- Data Analysis Tools: Like Microsoft Excel, Tableau, or Power BI to analyze process-related data.
- Simulation Software: Tools like Simul8 or Arena for simulating and analyzing different process scenarios.
-
How does business process analysis contribute to organizational efficiency?
- Identifying Inefficiencies: BPA helps identify bottlenecks, redundancies, and areas of waste within processes.
- Streamlining Workflows: By understanding the flow of activities, organizations can redesign processes to eliminate unnecessary steps and improve overall efficiency.
- Resource Optimization: BPA allows organizations to allocate resources more effectively, reducing costs and improving resource utilization.
- Continuous Improvement: BPA establishes a framework for ongoing analysis and improvement, ensuring that processes adapt to changing circumstances and remain efficient over time.
-
What are the common challenges faced during business process analysis?
- Resistance to Change: Employees may resist changes to established processes.
- Lack of Data: Incomplete or inaccurate data can hinder accurate analysis.
- Complexity: Some processes may be highly intricate, making analysis and optimization challenging.
- Limited Resources: Constraints in time, budget, or expertise can impact the depth and scope of analysis.
- Inadequate Stakeholder Involvement: Lack of involvement from key stakeholders can lead to oversight and incomplete analysis.
- Overemphasis on Technology: Focusing solely on technology without considering human factors or organizational culture can lead to suboptimal outcomes.
Addressing these challenges requires careful planning, effective communication, and a commitment to a collaborative and iterative approach to business process analysis.
-
How can organizations identify which processes to analyze?
- Criticality to Business Objectives: Prioritize processes that are directly tied to achieving organizational goals or customer satisfaction.
- Historical Performance: Identify processes that have shown signs of inefficiency, bottlenecks, or high error rates in the past.
- Customer Impact: Focus on processes that directly impact customers to enhance their experience and satisfaction.
- Regulatory Compliance: Analyze processes critical for compliance with industry regulations or standards.
-
What role does data collection play in business process analysis?
- Identifying Patterns: Data collection provides insights into patterns, trends, and anomalies within processes.
- Measuring Performance: Data helps quantify key performance metrics, such as processing time, accuracy, and resource utilization.
- Root Cause Analysis: Detailed data allows organizations to identify root causes of issues and inefficiencies.
- Basis for Improvement: Informed decision-making and targeted improvements are based on the analysis of collected data.
-
How do you measure the success of a business process improvement initiative?
- Key Performance Indicators (KPIs): Evaluate changes in relevant KPIs such as process cycle time, accuracy, customer satisfaction, and cost efficiency.
- Before-and-After Comparison: Compare the performance metrics before and after the implementation of improvements.
- Stakeholder Feedback: Collect feedback from employees, customers, and other stakeholders affected by the process changes.
- ROI Analysis: Assess the return on investment by comparing the costs of improvement initiatives against the benefits gained.
-
What is the difference between continuous improvement and process optimization in BPA?
- Continuous Improvement: Involves making incremental and ongoing enhancements to processes over time. It is a holistic approach that encourages a culture of constant refinement and learning, often driven by employee feedback and small, frequent adjustments.
- Process Optimization: Focuses on making significant, strategic changes to a process with the goal of maximizing efficiency and effectiveness. Optimization often involves reengineering or redesigning a process to achieve substantial improvements, sometimes leveraging new technologies or methodologies.
In summary, continuous improvement is an ongoing, evolutionary process, while process optimization involves more substantial, transformative changes.
-
How can benchmarking be effectively applied in business process analysis?
- Identify Benchmark Metrics: Choose key performance metrics that align with the goals of the organization and the specific processes under analysis.
- Select Suitable Benchmarks: Compare performance against industry standards, competitors, or best-in-class organizations to set realistic targets.
- Analyze Performance Gaps: Identify areas where organizational performance lags behind benchmarks to pinpoint improvement opportunities.
- Adopt Best Practices: Learn from the successful practices of benchmark organizations and implement them in your processes.
- Regularly Update Benchmarks: As industry standards and best practices evolve, ensure that benchmarks are regularly updated for relevance and accuracy.
Benchmarking helps organizations set realistic performance targets, learn from industry leaders, and continuously strive for improvement in their processes.
-
What are the potential pitfalls organizations should avoid during business process analysis?
- Lack of Stakeholder Involvement: Inadequate involvement of key stakeholders can lead to overlooking critical insights and potential improvements.
- Overemphasis on Technology: Focusing solely on technological solutions without considering human factors, culture, or process nuances.
- Insufficient Data Quality: Relying on inaccurate or incomplete data can result in flawed analysis and misguided improvement efforts.
- Failure to Consider Variability: Ignoring the dynamic nature of processes and failing to account for variations can lead to suboptimal solutions.
- Overlooking Cultural Factors: Neglecting the organizational culture and employee buy-in may hinder successful implementation of process changes.
- Not Addressing Change Management: Failing to have a comprehensive change management plan can result in resistance and implementation challenges.
-
How does BPA contribute to enhancing customer satisfaction and experience?
- Identifying Customer Touchpoints: BPA helps identify and optimize processes that directly impact customer interactions.
- Reducing Processing Times: Streamlining internal processes leads to quicker service delivery, positively influencing customer satisfaction.
- Improving Accuracy: Enhanced process accuracy results in fewer errors and better-quality products or services for customers.
- Real-time Communication: BPA facilitates real-time tracking and communication, keeping customers informed about the status of their orders or services.
- Personalization: By understanding customer journeys, organizations can tailor processes to individual needs, providing a more personalized experience.
-
Can business process analysis be applied to all types of industries and organizations?
- Yes, business process analysis is a versatile approach that can be applied to various industries and organizations, including:
- Manufacturing: Optimizing production processes for efficiency and quality.
- Healthcare: Streamlining patient care processes for improved outcomes.
- Finance: Enhancing transaction processing and risk management.
- Retail: Improving inventory management and order fulfillment.
- Service Industries: Enhancing service delivery and customer interactions.
- Regardless of the industry, BPA focuses on understanding, analyzing, and optimizing processes to achieve better organizational performance.
- Yes, business process analysis is a versatile approach that can be applied to various industries and organizations, including:
-
What are the steps involved in root cause analysis within the context of BPA?
- Identify the Problem: Clearly define the problem or issue affecting the process.
- Collect Data: Gather relevant data to understand the current state of the process.
- Map the Process: Create a process map to visualize the sequence of events leading to the problem.
- Brainstorm Potential Causes: Engage stakeholders in identifying potential causes of the problem.
- Prioritize Causes: Evaluate and prioritize potential causes based on their impact and likelihood.
- Investigate Root Causes: Dig deeper into the most likely causes, using tools like the “5 Whys” or fishbone diagrams.
- Verify Root Causes: Confirm identified causes through further analysis and data validation.
- Develop Solutions: Propose and implement solutions addressing the root causes.
- Monitor and Adjust: Regularly monitor the process to ensure sustained improvements and adjust solutions as needed.
Root cause analysis in BPA is a systematic approach to identifying and addressing the underlying issues that contribute to inefficiencies or problems within a business process.
-
How frequently should organizations conduct business process analysis?
- Regularly Scheduled Reviews: Business process analysis should be an ongoing and integral part of organizational practices.
- Trigger Events: Conduct analysis in response to significant organizational changes, technology upgrades, or process disruptions.
- Continuous Improvement: Organizations with a culture of continuous improvement may conduct smaller-scale analyses more frequently, often quarterly or monthly.
The frequency depends on organizational needs, but a regular and proactive approach ensures processes remain aligned with strategic goals and adaptable to changes.
-
What role does technology play in supporting business process analysis initiatives?
- Data Collection and Analysis: Technology tools facilitate the collection and analysis of process-related data, enabling a more accurate understanding of current processes.
- Process Mapping and Modeling: Software tools like Microsoft Visio, Lucidchart, or Bizagi aid in visually representing and modeling complex processes.
- Workflow Automation: Automation tools streamline routine tasks, improving efficiency and reducing manual errors.
- Simulation Software: Tools like Simul8 or Arena help simulate and analyze different process scenarios, supporting decision-making.
- Collaboration Platforms: Digital platforms enhance collaboration among stakeholders involved in the analysis, ensuring seamless communication.
Technology enhances the efficiency, accuracy, and collaboration aspects of business process analysis.
-
How can organizations ensure that the improvements identified through BPA are sustainable?
- Clear Documentation: Document process changes, including standard operating procedures (SOPs) and guidelines.
- Employee Training: Provide comprehensive training to employees involved in the modified processes.
- Continuous Monitoring: Regularly monitor key performance indicators (KPIs) to ensure sustained improvements.
- Feedback Mechanisms: Establish feedback channels to gather insights from employees and stakeholders.
- Adaptability: Design processes with flexibility to adapt to evolving business needs and changes in the external environment.
Sustainability is achieved through a combination of effective communication, training, monitoring, and a commitment to ongoing improvement.
-
What are the common misconceptions about business process analysis?
- Misconception 1: It’s Only for Large Corporations: BPA is valuable for organizations of all sizes, not just large corporations, as it helps improve efficiency and effectiveness.
- Misconception 2: It’s a One-Time Activity: BPA is an ongoing and iterative process, not a one-time project. Continuous improvement is a key aspect.
- Misconception 3: It’s Solely About Technology: While technology is a crucial enabler, BPA also involves understanding people, culture, and organizational dynamics.
- Misconception 4: It’s Only About Cutting Costs: While cost reduction is a common goal, BPA also focuses on enhancing customer satisfaction, quality, and overall organizational performance.
- Misconception 5: It’s Complex and Time-Consuming: BPA can be adapted to the organization’s complexity and scale, and modern tools have streamlined the analysis process.
Understanding and dispelling these misconceptions is essential for organizations to fully leverage the benefits of business process analysis.
In conclusion, the key to conducting a thorough Business Process Analysis (BPA) is a comprehensive understanding of the organization’s processes, involving clear identification, detailed mapping, meticulous data collection, and a commitment to continuous improvement. It requires collaboration among stakeholders, leveraging appropriate tools and methodologies to identify inefficiencies, bottlenecks, and areas for optimization, ultimately leading to enhanced organizational efficiency and effectiveness.