
Balance sheet analysis involves the examination and interpretation of a company’s balance sheet, which is one of the three main financial statements. The balance sheet provides a snapshot of a company’s financial position at a specific point in time, detailing its assets, liabilities, and shareholders’ equity.
3 Key Components
- Assets:
- Liabilities:
- Shareholders’ Equity:
For a comprehensive analysis, a balance sheet analysis should be done in conjunction with a cash flow statement analysis as well as income statement analysis.
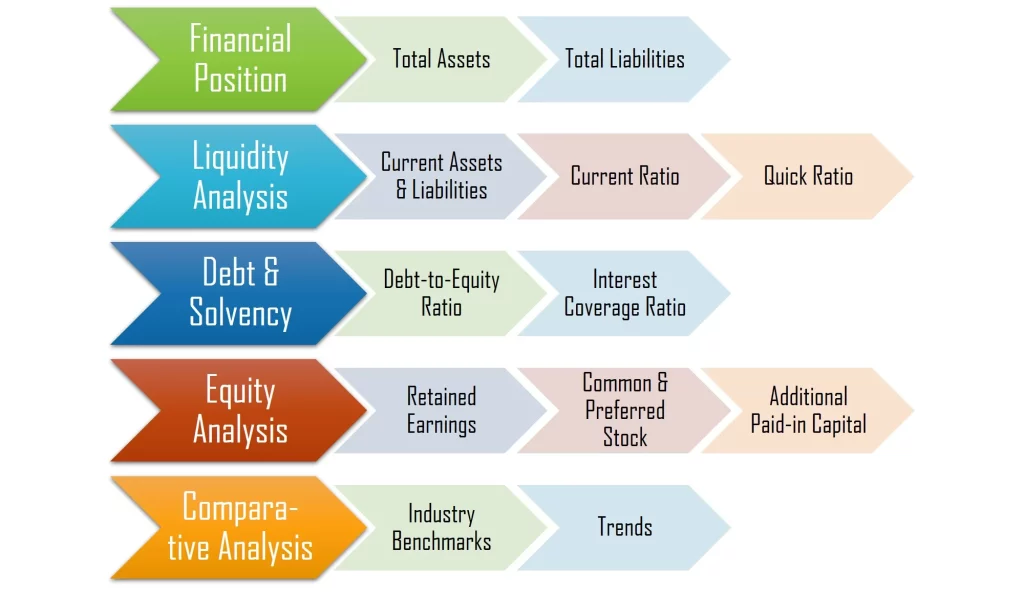
Key Activities
| Activity | What to Assess | Specifics to Consider | Interpretation |
|---|---|---|---|
| Financial Position | Evaluate the overall financial health and position of the company. | – Total assets and liabilities | A strong financial position indicates stability and capacity to meet obligations. |
| Liquidity Analysis | Assess the company’s ability to cover short-term obligations and maintain working capital. | – Current assets and liabilities
– Liquidity ratios |
Adequate liquidity is crucial for operational continuity. |
| Debt and Solvency | Analyze the company’s leverage, debt structure, and ability to cover long-term obligations. | – Debt-to-equity ratio
– Other solvency ratios |
Higher leverage may indicate increased financial risk, while lower ratios suggest lower risk. |
| Equity Analysis | Understand the composition and changes in shareholders’ equity. | – Retained earnings, common stock | Positive retained earnings and stable equity components contribute to financial stability. |
| Financial Ratios | Calculate and analyze key financial ratios derived from the balance sheet. | – Current ratio, quick ratio, debt ratio | Ratios provide insights into liquidity, solvency, and overall financial health. |
| Trend and Changes Analysis | Conduct trend analysis by comparing balance sheets over multiple periods. | – Changes in assets, liabilities, and equity over time | Identifying trends helps assess the company’s financial trajectory and areas of improvement. |
| Comparative Analysis | Compare the company’s balance sheet with industry benchmarks or competitors. | – Industry averages, competitor ratios | Understanding relative standing helps gauge competitiveness and financial health. |
Interpretation Tips:
This framework offers a structured approach to gaining insights into a company’s financial health and performance.
Example: Tesla Balance Sheet Analysis (2020 – 2023)
A. Financial Position
| Aspect | 2020 | 2021 | 2022 | 2023 |
|---|---|---|---|---|
| Total Assets | 52148 | 62131 | 82338 | 106618 |
| Total Liabilities | 29923 | 30548 | 36440 | 43009 |
Based on this data for Tesla Inc.’s total assets and total liabilities over the years 2020 to 2023, we can observe the following trends:
- Total Assets:
- Total Liabilities:
- Financial Position:
B. Liquidity Analysis
| Aspect | Formula | 2020 | 2021 | 2022 | 2023 |
|---|---|---|---|---|---|
| Current Assets | 26717 | 27100 | 40917 | 49616 | |
| Inventory | 4101 | 5757 | 12839 | 13626 | |
| Current Liabilities | 14248 | 19705 | 26709 | 28748 | |
| Current Ratio | = Current Assets / Current Liabilities | 1.88 | 1.38 | 1.53 | 1.73 |
| Quick Ratio | = (Current Assets – Inventory) / Current Liabilities | 1.59 | 1.08 | 1.05 | 1.25 |
The data above on Tesla Inc.’s current ratio and quick ratio over the years 2020 to 2023 offers insights into the company’s liquidity position:
- Current Ratio:
- Quick Ratio (Acid-Test):
- Liquidity Analysis:
C. Debt & Solvency
| Aspect | Formula | 2020 | 2021 | 2022 | 2023 |
|---|---|---|---|---|---|
| Total Debt | 29923 | 30548 | 36440 | 43009 | |
| Shareholders’ Equity | 22225 | 31583 | 45898 | 63609 | |
| Debt-to-Equity Ratio | = Total Debt / Shareholders’ Equity | 1.35 | 0.97 | 0.79 | 0.68 |
This data on Tesla Inc.’s debt-to-equity ratio over the years 2020 to 2023 offers insights into the company’s debt and solvency position:
- Debt-to-Equity Ratio:
- Implications:
D. Equity Analysis
| Aspect | 2020 | 2021 | 2022 | 2023 |
|---|---|---|---|---|
| Retained Earnings | -5399 | 329 | 12885 | – |
| Common Stock | 1 | 3 | 3 | 62634 |
The data on Tesla Inc.’s retained earnings and common stock over the years 2020 to 2023 provides insights into the company’s equity position:
- Retained Earnings:
- Common Stock:
- Equity Analysis:
Objectives of Balance Sheet Analysis
- Financial Position: Assess the company’s financial health and its ability to meet short-term and long-term obligations.
- Liquidity and Working Capital: Evaluate the company’s ability to cover its short-term liabilities and maintain sufficient working capital for daily operations.
- Debt and Solvency: Analyze the company’s leverage and solvency by examining the proportion of debt to equity and assessing its ability to cover long-term obligations.
- Asset Management: Examine the efficiency of asset utilization and management by analyzing inventory turnover, accounts receivable turnover, and other relevant ratios.
- Equity Analysis: Understand the composition of shareholders’ equity and assess the company’s financial structure, including the level of retained earnings and dividend history.
- Financial Ratios: Calculate and analyze key financial ratios derived from the balance sheet, such as the current ratio, quick ratio, debt-to-equity ratio, and return on equity.
- Trends and Changes: Conduct trend analysis by comparing balance sheets over multiple periods to identify changes in financial position, growth patterns, and areas of improvement or concern.
- Comparative Analysis: Compare the company’s balance sheet with industry benchmarks or competitors to assess its relative financial standing.
Balance sheet analysis is crucial for investors, creditors, and stakeholders to gain insights into a company’s financial structure, stability, and overall health. It complements other financial analyses, providing a holistic view of a company’s financial performance and aiding in decision-making processes.
Tips
- Understand the Basics: Familiarize yourself with the key components of the balance sheet, including assets, liabilities, and shareholders’ equity.
- Review Footnotes and Disclosures: Pay attention to footnotes and disclosures accompanying the balance sheet to gain additional insights into accounting policies, assumptions, and potential risks.
- Analyze Current vs. Non-Current Assets and Liabilities: Distinguish between current and non-current assets and liabilities to assess short-term and long-term financial obligations.
- Calculate and Interpret Ratios: Utilize key financial ratios such as the current ratio, quick ratio, debt-to-equity ratio, and return on equity to assess liquidity, solvency, and overall financial health.
- Evaluate Working Capital: Assess the adequacy of working capital by comparing current assets to current liabilities. Adequate working capital is essential for day-to-day operations.
- Examine Debt Structure: Analyze the composition of debt, distinguishing between short-term and long-term obligations. Evaluate the impact of debt on the company’s financial risk.
- Assess Asset Quality: Evaluate the quality of assets by considering factors such as inventory turnover, accounts receivable turnover, and impairments.
- Consider Equity Components: Understand the components of shareholders’ equity, including retained earnings, common stock, and additional paid-in capital.
- Look for Trends and Changes: Conduct trend analysis by comparing balance sheets over multiple periods to identify patterns, growth trajectories, and changes in financial structure.
- Compare with Industry Benchmarks: Benchmark the company’s ratios and financial metrics against industry averages or competitors to gauge its relative financial standing.
- Assess Cash Flow: Review the company’s cash flow statement to understand its ability to generate cash from operating activities and support ongoing business operations.
- Consider Economic and Industry Context: Take into account the broader economic environment and industry trends when interpreting the balance sheet. External factors can impact a company’s financial position.
- Verify Accounting Practices: Be aware of the accounting principles applied by the company. Consistent and transparent accounting practices contribute to the reliability of the balance sheet.
- Ask Questions and Seek Clarifications: When uncertainties or complexities arise, don’t hesitate to ask questions and seek clarifications from financial statements, management, or other reliable sources.
- Integrate with Other Financial Statements: Combine the insights gained from the balance sheet with information from the income statement and cash flow statement for a holistic view of the company’s financial performance.
In conclusion, the key to conducting a successful balance sheet analysis is a thorough understanding of the company’s financial position, emphasizing a focus on liquidity, debt management, asset quality, and trends over time, while considering industry benchmarks and economic context for comprehensive interpretation.